Those of you who study astronomy will recognize the old mnemonic astronomy students have long relied on to help memorize the stellar spectral classes: O,B,A,F,G,K,M.
The first thing that occurs to most us is why are the letters so random, not in any alphabetical order at all? Originally, students of stellar spectra arbitrarily classified them as A,B,C…and so on.
Eventually, it was determined these classes correlated to the temperature, and therefore the black-body color, of the stellar surfaces. The classes were rearranged, and some dropped altogether. The classification scheme now looks like this, in decreasing order of temperature
O 30,000 – 60,000 °K Blue
B 10,000 – 30,000 °K Blue
A 7,500 – 10,000 °K White
F 6,000 – 7,500 °K White (yellowish)
G 5,000 – 6,000 °K Yellow (like the Sun)
K 3,500 – 5,000 °K Orange
M 2,000 – 3,500 °K Red
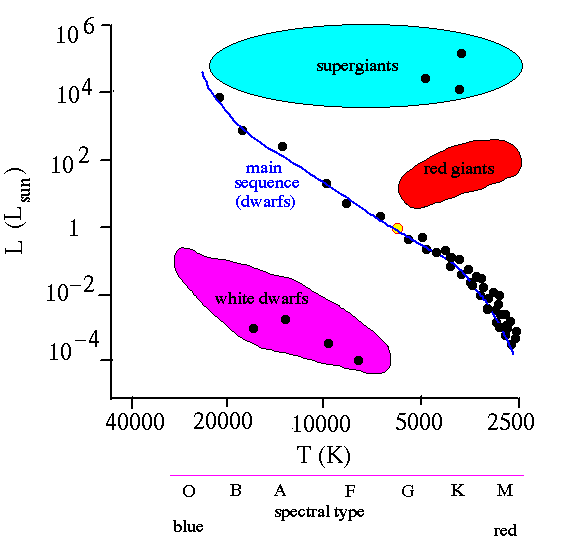
Einar Hertzprung and Henry Norris Russel independently discovered that if you plotted the spectral class against the log of the luminosity, you got the famous Hertzprung-Russel diagram, a simple scattergram which is one of the most powerful conceptual tools of astrophysical research, invaluable to the understanding of stellar structure and evolution.

The text and graphic was hard to read on my screen, you may prefer to view the original at
http://casswww.ucsd.edu/archive/public/tutorial/images/hr_diagram3.gif
This admittedly contrived and artificial relationship contains profound clues as to how nature works, it gives us an insight as to how stars evolve by simply plotting against each other the only two things we knew about them (at the time): their color and their brightness. Theories don’t have to be right to be useful. They only need systematize our thoughts so we can ask and evaluate the right questions.
This relationship had to be satisfied by any theory we might develop as to how stars form and evolve. It is a concrete visual representation of a very subtle and complex aspect of reality. It is not an answer to any question, it is a mental tool to suggest questions that might lead to an answer.
Today, we know a great deal about how stars are born, die, and evolve, and how they are put together inside. All just because someone thought of plotting one observable against another to see if it formed a pattern.
Many years ago, one of the programmers I worked with was a sweet little old lady who had been one of Russel’s students. She said Dr Russel always made it clear in his classes that it was always to be called the “Russel-Hertzprung Diagram”.
-
Thanks, ER, I enjoy these essays.
-
PS: