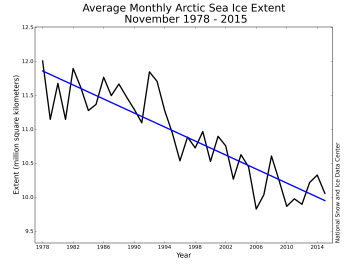
All through November in the Arctic, the sun drops lower, it gets darker and colder, and the ice comes back. So how does this November compare with all the other Novembers since our satellites have been monitoring the ice? This is data, not interpretation, or spin, or conspiracy theory. The numbers on the two axes are calendar year in X, millions of sq km of sea ice extent in Y.
These numbers are not as dramatic as the lowest-ice month of
September but the overall trend (the blue regression line) is still down, as it always is for every single month of the year.

http://nsidc.org/arcticseaicenews/files/2015/12/monthly_ice_11_NH-350×270.png