http://neven1.typepad.com/blog/2016/05/asi-2016-update-1-both-sides.html#more
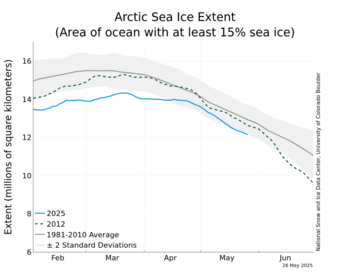
The Neven Ice Blog has just published a detailed summary, supported by graphs, charts and animations, of the coming 2016 melt season, which is now well underway. This is starting to look like a very bad year in the Arctic, and although it is really too early to tell whether current trends will continue until the low ice time in mid-September, there is already much talk that the former low-ice record year, 2012, will be surpassed. Its about due for it, for the last four decades, the low-ice record has been broken on the average about every four or five years. The mid-September 2012 ice extent was about 4 million km^2.
There’s a lot of data and analysis in this article, these statistics on ice extent are only a sampler:
1,220,829 km2 below 2000s average for this date.
763,419 km2 below 2010s average for this date.
529,970 km2 below 2015 value for this date.
1,090,443 km2 below 2012 value for this date.
Lowest year-to-date (01 January – 26 May) average.
Lowest May to-date average.
Lowest value for the date.
92 days this year (63.01% year-to-date) have recorded the lowest daily extent.
27 days (18.49%) have recorded the second lowest.
14 days (9.59%) have recorded the third lowest.
133 days in total (91.1%) have been among the lowest three on record.
Neven concludes his comments with the following:
Conclusion
A melting season can be divided into several segments that all influence the process and final outcome. The winter or freezing season that determines initial sea ice conditions, is followed by a transition phase where leads still freeze over, but ice hardly gets any thicker. Then, as the melting season gets under way, melt ponds start to form on the ice floes, soaking up solar energy and building up melting momentum.
If you would write a scenario for how the first ice-free September comes about, it would look something like this. I don’t think Arctic sea ice extent will dip below the 1 million km2 mark this year, simply because the ice in the Arctic’s core is too thick to melt out. Never say never, though. It is the Arctic after all, and things have been progressing much, much faster than people (including scientists) thought was possible just a few years ago.
Considering what has happened so far, a new record minimum is a distinct possibility though. If a lot of melt pond formation occurs this month and the next, it will take some extremely cloudy and cold weather during July and August to prevent records from being broken. And even then the minimum will most probably be among the lowest on record. So melt pond formation is what I will be focussing on in weeks to come.
This melting season is looking spectacular and exciting, but at the same time depressing and frightening, given the almost certain negative effects of this magnitude and rate of change. Let’s hope for the best.
http://nsidc.org/data/seaice_index/images/daily_images/N_stddev_timeseries_thumb.png