http://greatwhitecon.info/2017/03/facts-about-the-arctic-in-march-2017/
Most of the graphics I publish here refer to sea ice area, or a related metric, sea ice extent. I usually stick to these metrics because they are extremely sensitive to global temperatures, they foreshadow a key positive feedback loop in polar temperature regulation, and they are direct, comparable, unambiguous raw data right off the same satellites, i.e., they are denialist spin proof.
However, a much more meaningful barometer about what is going on in the Arctic is sea ice VOLUME, which not only carries information on how cold it is at the poles, but how prone it is to future change. Volume tells us not only about how widespread the ice is, but how THICK it is. It addresses the amount and durability of the ice at any time.
Unfortunately, unlike area/extent, volume is not a directly measured quantity from one sensor, it is a derived parameter modeled from many sensors and observations, so denialists attack it with charges that it is based on unwarranted assumptions and corrupted by dishonest scientists trying to sway public opinion.
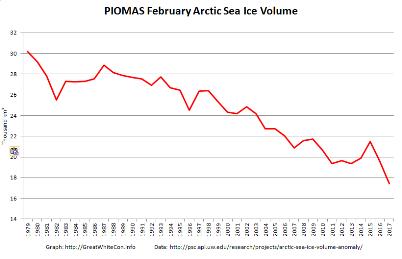
Be that as it may, I have published below sea ice volume figures from PIOMAS compiled since the beginning of the satellite era for the February sea ice volume. February is a key month, the ice is at maximum volume before the start of the spring melt and from now until September it will be dropping. This graph shows the February polar ice volume at
an all-time low, compared to other Februaries over the last five decades.
Every year, in autumn, the ice volume starts to grow as the Arctic cools. But each year there is less ice to start with. As I often point out, low ice in winter is not particularly well correlated with low ice in summer, (short term weather and ocean conditions play a role as well as temperature). But this moderating effect, this “flywheel” or “governor” if you like, is rapidly being removed from the global climate engine. What happens when thick, multi-year ice goes away in winter, and only thin, first-year ice remains, is not totally clear. But I do believe it is safe to say there will be an effect. With no summer ice, every bit of sunlight in those long polar days will be absorbed directly into the wine-dark sea, not reflected back into space.
Note the units of the volume on the vertical axis. Since 1979, the ice volume has dropped from approximately 30 to 18 thousand cubic kilometers (I believe “million” on the graph is a typo). But, it’s the trends that really matter. I’ll let you calculate the percentage drop yourself, lest I am accused of being too alarmist.
http://greatwhitecon.info/wp-content/uploads/2017/03/PIOMAS-2017-02-768×496.png

Alternative link for this graph:
http://greatwhitecon.info/wp-content/uploads/2017/03/PIOMAS-2017-02-400.jpg
