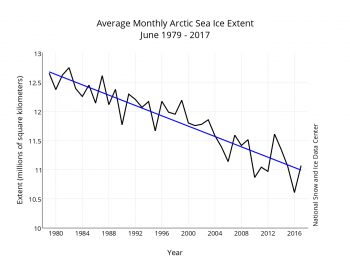
It’s been five years since the last record, 2012. And ten years since the previous record, 2007. Is this a pattern?
http://nsidc.org/arcticseaicenews/files/2017/07/Figure3-350×270.png

Arctic ice extent near levels recorded in 2012
July 5, 2017
Contrasting with the fairly slow start to the melt season in May, June saw the ice retreat at a faster than average rate. On July 2, Arctic sea ice extent was at the same level recorded in 2012 and 2016. In 2012, September sea ice extent reached the lowest in the satellite record. As a new feature to Arctic Sea Ice News and Analysis, NSIDC now provides a daily updated map of ice concentration in addition to the daily map of ice extent.
http://nsidc.org/data/seaice_index/images/daily_images/N_daily_concentration_hires.png
The following graphic keeps a running tab on ice extent and compares it to the record year of 2012 as well as the median and quartile ranges for the satellite era. I figure we have a very good chance of breaking the 2012 record this year, or coming pretty damn close.
https://nsidc.org/data/seaice_index/images/daily_images/N_iqr_timeseries.png
No, it doesn’t look like Arctic ice is “recovering” to me.
This is the NSIDC July report summarizing Arctic Sea Ice in June. Just in case I’m not around early in October, check this website for the September numbers to see if we break that record or not.
BTW, here’s the PIOMAS Arctic Sea Ice VOLUME figures for
June.
http://neven1.typepad.com/.a/6a0133f03a1e37970b01bb09abef30970d-pi