http://nsidc.org/arcticseaicenews/files/2018/08/Figure3-350×270.png
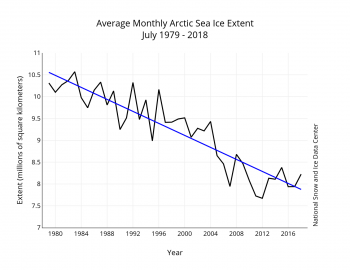
Remember, each data point is a monthly average, NOT the low point for that month.
Arctic sea ice extent declined rapidly the latter half of July, despite the persistence of low sea level pressure over the Arctic Ocean and generally cool conditions. At the same time, unusually high sea level pressure persisted over the United Kingdom and Scandinavia, where several new record high temperatures were reached, fostering extensive wildfires.
Arctic sea ice extent for July 2018 averaged 8.22 million square kilometers (3.20 million square miles). This was 1.25 million square kilometers (483,000 square miles) below the 1981 to 2010 long-term average sea ice extent, and 550,000 square kilometers (212,000 square miles) above the record low for the month set in July 2012. July 2018 was the ninth lowest July extent in the satellite record.
What this all means for September is anybody’s guess. The ice is melting fast, but it got a late start. If it can maintain this rate of loss for the next six weeks we may get another record low. My guess? No breaking the 2012 record this year, but I’m expecting third or fourth lowest SIE for sure.
https://nsidc.org/data/seaice_index/images/daily_images/N_iqr_timeseries.png

It is really difficult to characterize the Arctic ice trends with text, tables, or even a few simple graphs or maps. I strongly suggest you play with NSIDC’s interactive graphic so you can appreciate not only how much ice has been lost while we’ve been monitoring the Arctic since 1979, but what the long term trends are. The interactive graph allows you to turn individual curves for each year on and off. In particular, look at the last 10 years or so…
https://nsidc.org/arcticseaicenews/charctic-interactive-sea-ice-graph/