Its hard to tell precisely, but it appears the Arctic sea ice extent has bottomed out for 2018, and falling temps have started re-freezing the top of the world. This year wasn’t particularly ice-free, it appeared like this minimum came in 5th or 6th in the satellite record. However, 2018 does have one remarkable stat, the minimum has come later in the year than ever. The lowest 2 years, 2012 and 2007 hit minimum extent almost two weeks ago.
The 2018 SIE is flat now, but it is possible that currents and winds might even drive it lower still, in spite of the falling fall temperature! As of 24 September, the SIE is 4.6M km^2, 3rd in line below 2012 (3.6M km^2) and 2007 (4.2M km^2) on 24 Sep. All those other years that had less ice on the water at minimum quickly regained ice cover after minimum, but this year seems to be delaying the freeze, allowing it to surpass all those other years (except the record 2012 and 2007).
This is difficult to explain verbally, but if you take the time to play with the Charctic interactive graph at the NSIDC website, you’ll see what I mean.
https://nsidc.org/arcticseaicenews/charctic-interactive-sea-ice-graph/
Sea ice extent is a metric that is easy to measure accurately with satellites, and it provides a continuous and unambiguous parameter that can be compared over the years, but it is not perfectly correlated with climate change. SIE depends a great deal on how winds and currents compact and disperse the ice pack, and it tells us nothing about ice thickness. Consequently, how you slice and display the data makes a difference. Actually looking at the daily curves over time on a graph tells you a lot more than just listing the daily values.
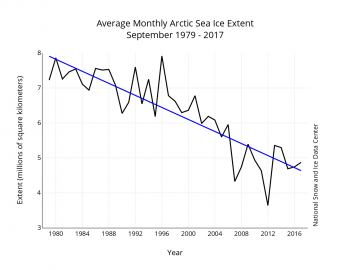
Early in October, NSIDC will publish its SIE time series graphic, which compares the September averages for the last 40 years, and draws a linear regression line through them. This gives you a smoothed look at the overall trends. I will post it here as soon as its available, it is the most convincing data we have that global warming is real and severe. Here is last year’s edition of this graph: