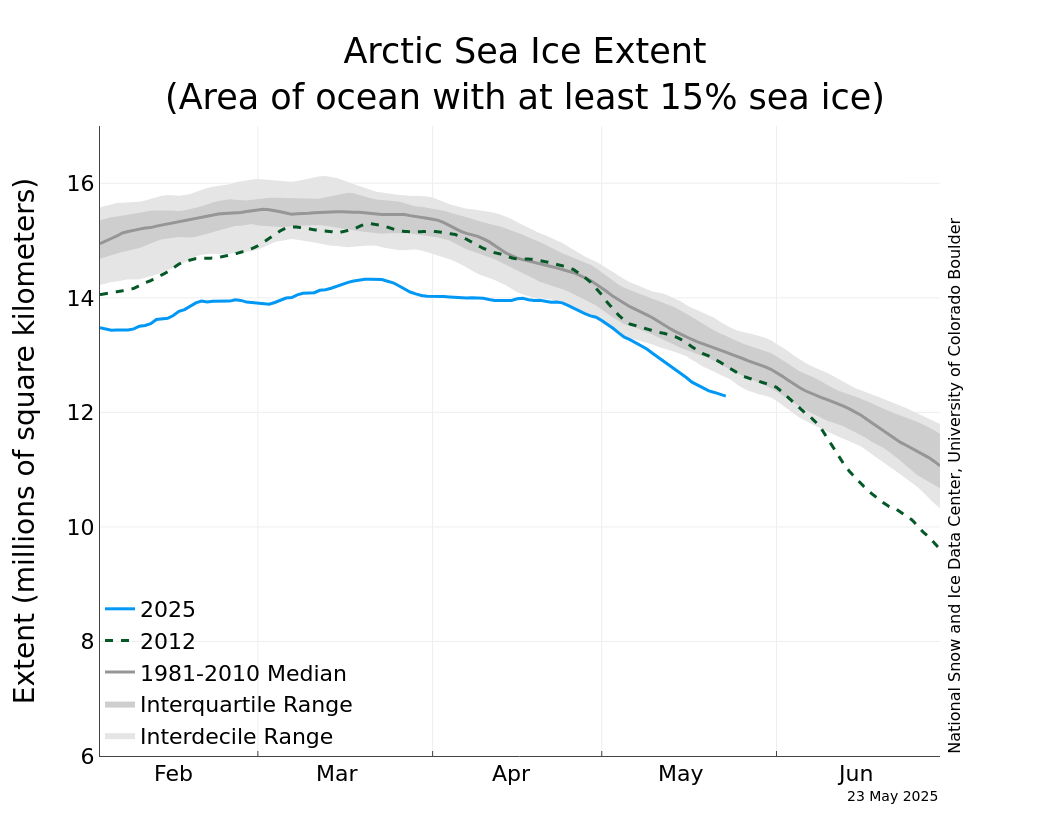
It looks as the Arctic Sea Ice extent has finally bottomed out for the year. Vagaries of wind and tide may shuffle the ice around a bit more, but it looks like the summer melt is over.
SIE minimum for 2020 has bumped 2007 into a distant third place, only the extreme record year of 2012 had less ice in the Arctic Basin. Also, I can’t emphasize too much, take advantage of NSIDC’s interactive CHARCTIC graph so you can display how these curves have trended further and further down in the four decades we’ve had satellite data available to us. I can’t reproduce it here, but it is easy for you to go to
https://nsidc.org/arcticseaicenews/sea-ice-tools/
and look for yourself. The graphical evidence is terrifying.
https://nsidc.org/data/seaice_index/images/daily_images/N_iqr_timeseries.png

Early next month, NSIDC will publish the Mean SIE for September in a chart comparing it to previous September averages. Keep in mind, this value will be more representative of global warming activity since it smooths out the daily SIE fluctuations over the entire month.
I will keep you posted. This is important. A fascist takeover and a global pandemic are small beans compared to global warming. The human race has survived innumerable plagues and diseases before but a major climatic shift over one lifetime is something we’ve never experienced before. Stay nude for the tunes.
-
I'm staying tuned, believe me.