• Space/Science
  • GeekSpeak
  • Mysteries of
    the Multiverse
  • Science Fiction
  • The Comestible Zone
  • Off-Topic
  • Community
  • Flame
  • CurrentEvents

Recent posts

Trump Administration Readies Plans to Dismantle Renowned Science Lab BuckGalaxy March 13, 2026 11:46 pm (Space/Science)

The Republic RobVG March 11, 2026 11:40 am (Off-Topic)

The Great Lie of War BuckGalaxy March 5, 2026 9:23 am (CurrentEvents)

Overheard on the internet... ER March 4, 2026 4:37 pm (CurrentEvents)

I hate waking up to war podrock February 28, 2026 11:04 am (CurrentEvents)

The religion of nonreligion can be like nonalcohol beer: What’s the point? BuckGalaxy February 28, 2026 2:25 am (Off-Topic)

MAGAlomania unleashed again BuckGalaxy February 28, 2026 2:21 am (CurrentEvents)

‘We’re Going to the Moon and Mars’ BuckGalaxy February 26, 2026 8:41 pm (Space/Science)

Is This the Most Important Supreme Court Case of the Century? BuckGalaxy February 22, 2026 8:56 pm (CurrentEvents)

Supreme Court tries to do Trump a favor BuckGalaxy February 20, 2026 10:58 am (CurrentEvents)

Role reversal ER February 20, 2026 7:58 am (Off-Topic)

When Will This War End? The Question Is Meaningless. BuckGalaxy February 15, 2026 5:56 pm (CurrentEvents)

Home » Space/Science

The November numbers December 5, 2022 12:08 pm ER

https://nsidc.org/arcticseaicenews/files/2022/12/Figure-3_TrendLine-350×270.png

The overall trend for November Sea Ice Extent (SIE) is negative at the global level, when considered over the last few decades. But on a year-to-year basis, we seem to have entered a time of extreme volatility. Could this be a sign of a system approaching instability?

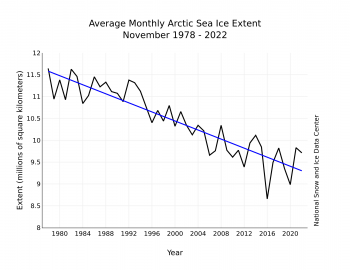
Just keep in mind, in spite of all these local variations, the overall trend for EVERY month of the year has been downward. There is no season that hasn’t experienced, on the average, some ice loss since the beginning of the satellite era. Even if we arbitrarily remove the 2012 superminimum from the graph altogether, the general trend, for Every month, is still down.

Again, we should recall that SIE is highly dependent on local and short term conditions, such as currents and winds, precipitation and storms, but the extreme low SIE year of 9/2012 has not repeated now for a decade. Prior to 2012, the record low SIE was broken on the average about once every 5 years. In other words, we’re long overdue for another broken record low ice event. Does this have any significance? I suspect it doesn’t, only the slope of the overall trend, averaged for all the years we have data, matters. But who knows? We’re in uncharted waters, and at the risk of mixing my metaphors, on increasingly thin ice.

    Search

    The Control Panel

    • Log in
    • Register