Remember, its winter in the Southern Hemisphere
Sea ice surrounding the Antarctic continent continues to be exceptionally low. Antarctic ice extent as of mid-July is more than 2.6 million square kilometers (1.00 million square miles) below the 1981 to 2010 average, an area nearly as large as Argentina or the combined areas of Texas, California, New Mexico, Arizona, Nevada, Utah, and Colorado. It is 1.6 million square kilometers (618,000 square miles) below the previous record low extent for the date, set in 2022 (Figure 4a). Low ice extent is present nearly everywhere, but particularly in the northern Weddell Sea, western Ross Sea, and southern Bellingshausen Sea (Figure 4b). Above average extent is prevalent in the Amundsen Sea.
The research community has been discussing the causes for the sudden turnabout in Antarctic sea ice extent, from a weakly positive linear trend from 1978 to 2015 to a strongly negative trend since 2016; and the events of 2022 and 2023 have garnered much attention. Many recent studies point to changing conditions in the upper ocean layer. Warm water from the north has mixed into this layer, which tends to increase the stratification of the ocean. This appears to coincide with when sea ice went from record high extents to low extents beginning in September 2016, and still lower extents in 2023.
For a better look at these graphics, I suggest you refer directly to the source at nsidc.org
Antarctic sea ice extent
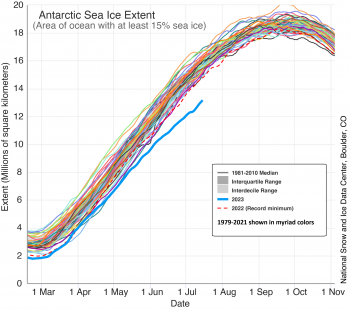
Figure 4a. The graph above shows sea ice extent for February 18 to November 2 for every year in the 45-year satellite data set, with 2023 shown in blue. The dashed red line is the 2022 ice extent, which was the former record summer minimum low before 2023.||Credit: Ted Scambos, Cooperative Institute for Research in Environmental Sciences|
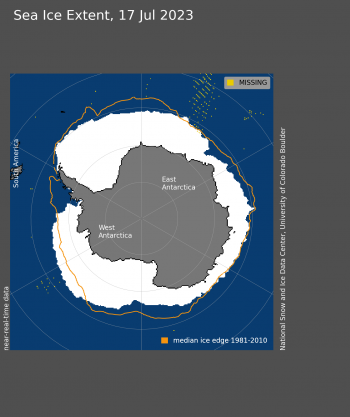
Figure 4b. Antarctic sea ice extent for July 17, 2023 was 13.45 million square kilometers (5.19 million square miles). The orange line shows the 1981 to 2010 average extent for that day. Sea Ice Index data. About the data||Credit: National Snow and Ice Data Center
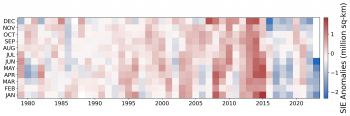
Figure 4c. This figure shows the monthly Antarctic sea ice extent (SIE) anomaly (difference relative to the 1981 to 2010 average) for January 1979 to July 2023. The x-axis shows years, 1979 through 2023. The y-axis shows months of the year from January (bottom) to December (top). Red shades indicate higher than average extent, while blue shades indicate lower than average extent, with darker shades corresponding to larger differences. ||Credit: Julienne Stroeve, National Snow and Ice Data Center|High-resolution image