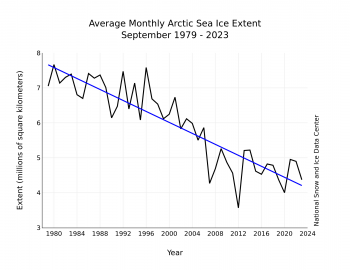
The graph above is the most important display of global warming data published by NSIDC.org
Published in early October, it displays the average sea ice extent for the lowest average September ice cover in the Arctic Basin, along with September averages for all the years the satellites have been observing the icecap. Although SIE hits its annual low in mid September, posting the full month average damps down most of the noise in the data, irregularities due to wind and current breaking up and clumping floating ice. The blue regression line represents the general trend. Since 1979 the summer ice has gone from about 7.6 to 4.2 million square kilometers (by just eyeballing the graph). About half of the Arctic Ocean’s summer ice has disappeared in the last 40-odd years.
The downward linear trend in Arctic sea ice extent for September over the 45-year satellite record is 78,500 square kilometers (20,300 square miles) per year, or 12.2 percent per decade relative to the 1981 to 2010 average (Figure 3). Based on the linear trend, since 1979, September has lost 3.45 million square kilometers (1.33 million square miles) of ice. This is roughly equivalent to twice the size of Alaska or Iran.
At this rate, the summer Arctic ice cap will be ice free by the end of this century.