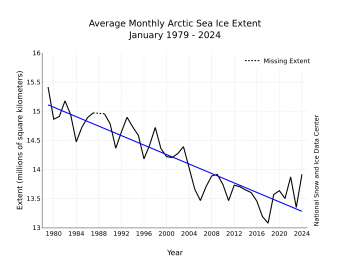
The downward linear trend in Arctic sea ice extent for January over the 45-year satellite record is 41,000 square kilometers (16,000 square miles) per year, or 2.8 percent per decade relative to the 1981 to 2010 average (Figure 3). Based on the linear trend, January has lost 1.73 million square kilometers (668,000 square miles) of ice since 1979. This is equivalent to the 2.5 times the size of state of Alaska or the country of Iran. However, the relatively high ice extent for January 2024 is notable.
Surface ice is trending up, but ice thickness is not…
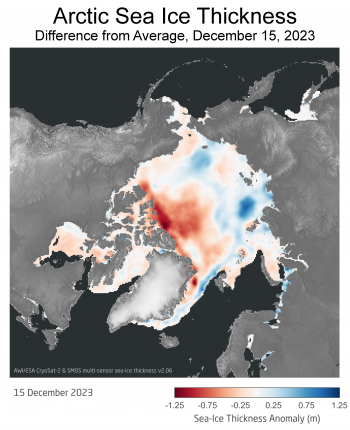
As Arctic sea ice extent starts approaching its maximum, ice thickness can provide an indication of the state of the ice cover. The most recent (mid-December 2023) thickness analysis from the ESA SMOS & CryoSat-2 Sea Ice Data Product Processing and Dissemination Service at Alfred Wegener Institute indicates up to 1.25 meters (4.1 feet) thicker ice than the 2011to 2023 average over the Siberian side of the Arctic, with ice on the North American side up to 1.25 meters (4.1 feet) thinner than average (Figure 4b). This suggests that there may be a slower melt out of ice in the Siberian coastal seas, but perhaps faster in the Beaufort Sea.
Actually, things don’t look too bad. But remember, its still the middle of winter. Spring is just around the corner.
The sun is returning to the Arctic Basin, and things will start really warming up in March. And remember, this graphic is keyed to the 2011 to 2023 average, not the 1979 to 2023 average. The effects of global warming are most notable in the North after the Big Melt in September. Let this data serve as the comparison benchmark for the deep summer numbers.