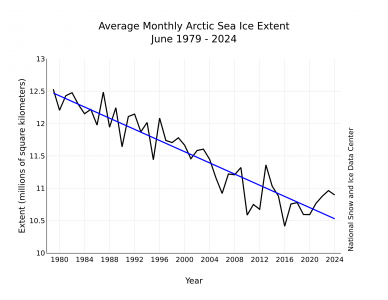
Including 2024, the downward linear trend in Arctic sea ice extent for June is 43,000 square kilometers (17,000 square miles) per year, or 3.7 percent per decade relative to the 1981 to 2010 average. Based on the linear trend, since 1979, June has lost 1.96 million square kilometers (757,000 square miles) of sea ice, which is roughly equivalent to three times the size of Alaska or 47 times the size of Switzerland.
Keep in mind the y-axes of these graphs are adjusted so that the range in SIE values is expanded to fit the space available on the page. The appearance of all the graphs is roughly the same, but the slope of the blue line as well as the number scale on the left is much more extreme as the summer progresses. The graph published in October, reflecting the low ice month of September, is going to be the one to wait for… It may not beat the record low ice year of 2012, but it will be close to it. We still have three months of midnight suns to look forward to.
This is what the Sept 2012 time series looked like:
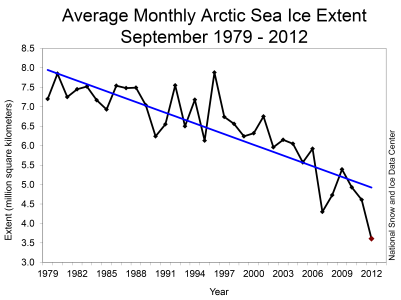
Please forgive me if I seem to be flogging the proverbial dead horse with these graphs, but this is the most dramatic and convincing evidence I can think of that is warning us of the coming horror. This data should be published every night on the evening news, right after the sports scores and the Dow Jones. Nothing else really matters any more.
Antarctic sea ice extent continues to track well below all previous years except for 2023, the year of the lowest ice extent in the satellite data record. At month’s end, sea ice was more than 2 million square kilometers (772,000 square miles) below the 1981 to 2010 average, but still 500,000 square kilometers (193,000 square miles) above the exceptionally low 2023 extent (Figures 7a and 7b). The ice cover this year is particularly low in the Amundsen Sea, as well as in the Indian Ocean sector. Extent is near average in the Pacific Ocean sector and the Ross Sea, whereas in the western Weddell Sea and Bellingshausen Seas, the ice is above average. Unusually low sea ice extent in the Indian Ocean sector was also a prominent feature of the 2023 sea ice season.