https://gml.noaa.gov/ccgg/trends/weekly.html
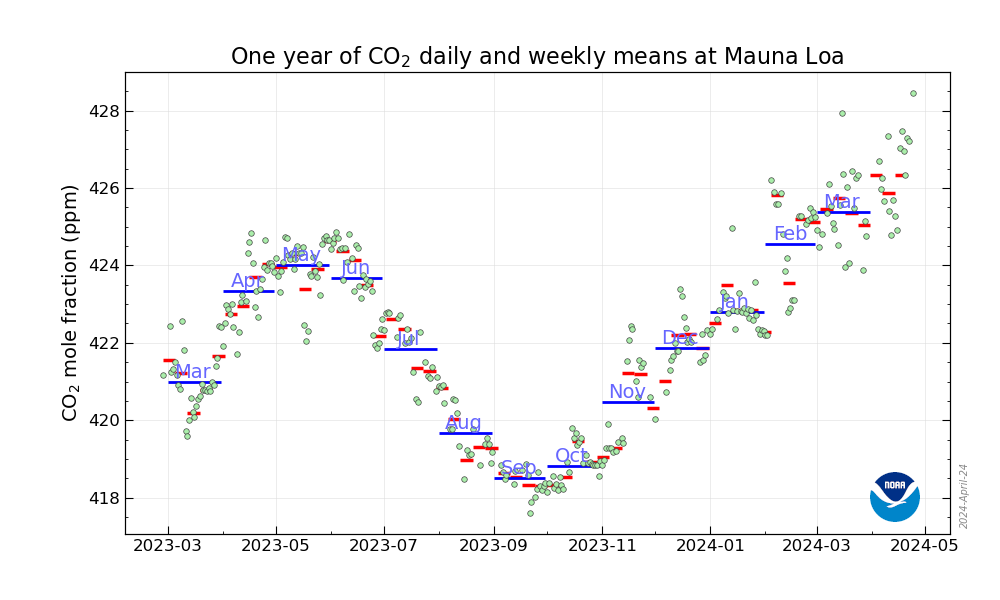
The big sinusoidal feature is seasonal, and natural. CO2 concentrations in the atmosphere are partially modulated by natural mechanisms.. But by comparing any month’s levels with concentrations from the previous year, it is clear there is a systematic component as well, one quite independent of weather or other natural processes.

Stepping back from the short term view…
https://en.wikipedia.org/wiki/Keeling_Curve

The absolute values on the axes tell us this has not been exaggerated by clever mathematical display conventions. In the last quarter of a century the concentration of CO2 in the atmosphere has increased by about 25%. Not only is the CO2 increasing, the rate at which it is increasing is also increasing. And this rate is not a subtle, nuanced effect, it is increasing at a rate and in amounts noticeable over a human lifetime.
Much more CO2 is absorbed in the oceans and exists as a dissolved gas in sea water. Much is also absorbed by marine organisms in plankton and mollusks to form calcium carbonate shells (and eventually limestone). This acts as a buffer to help moderate CO2 concentrations in rock, sea and atmosphere. But how effective this mechanism is in the long run is questionable. CO2 in aqueous solution exists as carbonic acid, which actively dissolves carbonates in solid form. How long this carbon sink remains operational is anyone’s guess. Especially as our coral reefs are dissolving back into the atmosphere…
It may be just a coincidence, but it is interesting to note that yearly atmospheric CO2 concentration is minimum in mid-September, about the same time Sea Ice Extent in the Artic reaches its yearly low.