• Space/Science
  • GeekSpeak
  • Mysteries of
    the Multiverse
  • Science Fiction
  • The Comestible Zone
  • Off-Topic
  • Community
  • Flame
  • CurrentEvents

Recent posts

A Taste of Armageddon RobVG July 2, 2025 8:00 am (CurrentEvents)

We've got company ER July 2, 2025 7:50 am (Space/Science)

All Along the Watchtower ER July 1, 2025 9:13 pm (CurrentEvents)

Birthright Citizenship RobVG June 29, 2025 3:34 pm (CurrentEvents)

To be blunt, NASA is now dead RL June 27, 2025 11:56 am (Space/Science)

Musk trashes his own AI after it chose a liberal worldview. RobVG June 23, 2025 9:56 am (CurrentEvents)

Psyche keeps its date with an asteroid BuckGalaxy June 22, 2025 5:21 pm (Space/Science)

Just for the record... ER June 22, 2025 8:59 am (CurrentEvents)

The Three Unknowns After the U.S. Strike on Iran BuckGalaxy June 22, 2025 12:58 am (CurrentEvents)

There are only nine meals between mankind and anarchy. BuckGalaxy June 22, 2025 12:29 am (Flame)

Not ready for prime time BuckGalaxy June 19, 2025 12:18 pm (Space/Science)

hypocrisy ER June 15, 2025 2:30 pm (Flame)

Home » Space/Science

The Suns of August September 5, 2012 5:22 pm ER

The National Snow and Ice Data Center has just released the arctic sea ice numbers for August, and as expected, the news is not good. Compared to the satellite record for previous Augusts, this year has broken all records.

http://nsidc.org/arcticseaicenews/

.

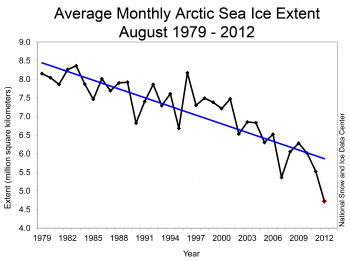
Of course, after breaking the previous record, 2007, on 24 Aug, the melting in the Arctic has not bottomed out yet. Traditionally, lowest ice in the N Polar Ocean occurs in mid-September, although it seems to be coming later every year now, and we still have a ways to go yet. You will note these are not statisical outliers, or marginal results, these are clear and obvious trends and the results are, to put it mildly, dramatic.

Sea ice minima are roughly half what they were just 30 years ago. There are 4 million square km more of dark ocean exposed to sunlight than there were three decades ago.

http://www.ijis.iarc.uaf.edu/en/home/seaice_extent.htm

.

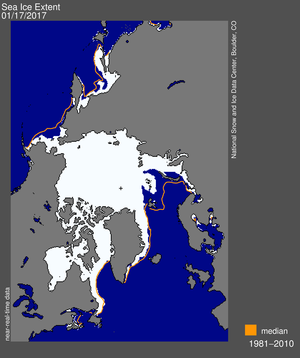
The orange line is the median ice extent for 4 Sept for the last decades of the 20th century. Think of it as how much summer ice was lost in just the last 12 years.

.

Next month’s numbers should be very interesting. Stay tuned.

  • Looks like it's dropping off that blue trendline, in the first graph. by alcaray 2012-09-05 22:17:28
    • As you no doubt know, the trendline is a linear regression. by ER 2012-09-06 04:13:39

    Search

    The Control Panel

    • Log in
    • Register