About this time of year, authorities and agencies that monitor, or otherwise have an interest in, Arctic ice cover publish their predictions as to how low the Arctic ice will go at the height of the melt season in September.
The great variation in these predictions reflects the methodology and ideology of the predictors, as well as the inherent variability of local weather conditions. and the essential stochastic nature of the forces at work in the climate.
Pay particular attention to the horizontal dashed lines denoting particular statistics of interest (for example, 2012 was the record-breaking low ice year.
http://neven1.typepad.com/.a/6a0133f03a1e37970b01a3fd2453c4970b-pi
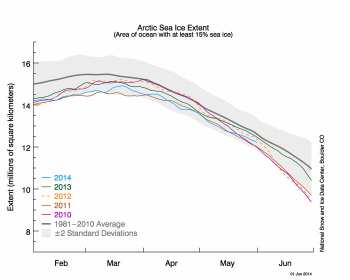
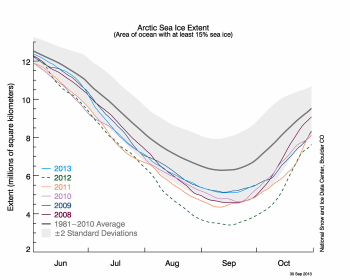
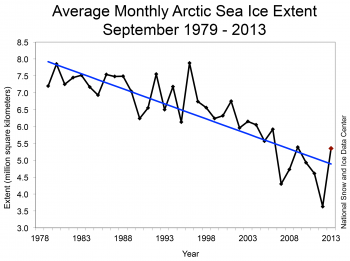
Interested in making your own prediction? Here’s some data!
http://nsidc.org/arcticseaicenews/files/2014/06/Figure2-350×280.png

http://nsidc.org/arcticseaicenews/files/2013/10/asina_N_stddev_timeseries-350×280.png

http://nsidc.org/arcticseaicenews/files/2013/10/Figure3_Sept2013_trend-350×261.png
