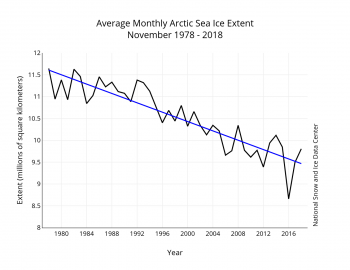
Its getting colder and darker in the Arctic, its autumn and the ice is taking over again. This is a time of year (unlike the summer) when the effects of global warming are not as dramatic, and where the variation over the years is noisy and intermittent. Still, comparing the average November ice pack with other Novembers still conveys the same grim message, just not as stridently. Average November ice extents are dropping at about 5%/yr.
It is interesting to note that even though the overall drop in November ice coverage has remained fairly constant over the last 40 years that we have been taking satellite measurements, the variations from the mean have become more extreme during the second half of the period of interest.
Could this be a sign of a complex system, one with many interconnected moving parts and multiple feedback loops, approaching a condition of catastrophic collapse? During this first half of the period of satellite monitoring, the decline of ice extent in every month of the year has been steady but controlled. Since the early years of the 21st century the system appears to be fibrillating. This is a behavior not uncommon in complex systems under extreme stress. The systems flex and stretch, compress and expand, increasingly violently until they shatter unexpectedly.
It would be interesting to graph the average deviation from the regression (the absolute value of the residuals, for you statistics weenies) for each year and plot them as a time series graph. I expect the curve would increase slowly at first, start climbing around the turn of the century, then rapidly become asymptotic somewhere in the near future, probably around mid-century.
Well, I don’t have kids, and as in the impending budget crisis, “I won’t be here” when it blows up.
https://nsidc.org/arcticseaicenews/files/2018/12/Figure-3-350×270.png