https://nsidc.org/data/seaice_index/images/daily_images/N_iqr_timeseries.png

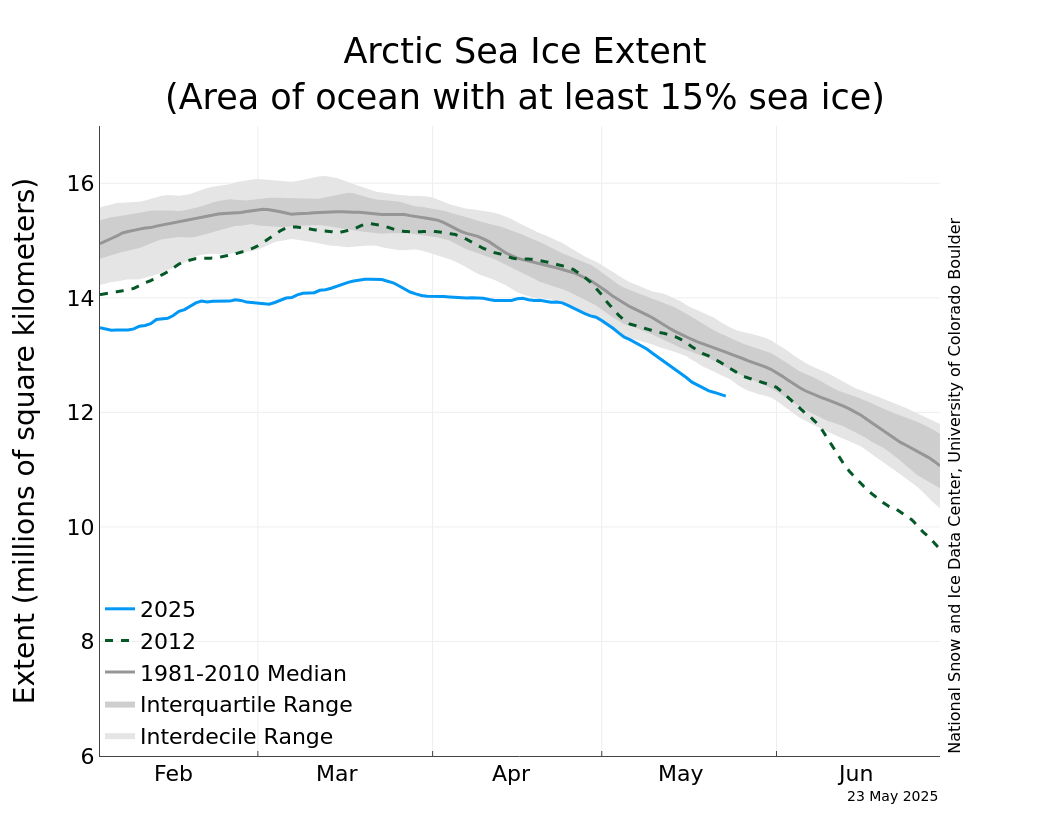
According to the latest satellite results, Arctic Sea Ice Extent (SIE) is tracking slightly below the record September low SIE year of 2012. The SIE for today, 10 July, is the lowest it has ever been on this date. By itself, this means little. As I have mentioned before, spring SIE is a poor predictor of summer SIE. Around this time of year, the summer melt is well underway and the SIE numbers are plunging neck-and-neck towards their September lows, regardless of what year you pick. The SIE values have all been well below average since the year 2000, an indication that whatever is happening in the Arctic, it is getting worse, and it is getting worse faster.
I highly recommend you bring up the NSIDC’s Charctic Interactive Graph
https://nsidc.org/arcticseaicenews/charctic-interactive-sea-ice-graph/
for a graphical display of what the Arctic SIE has been doing over the satellite era. You can zoom, turn each year on and off, and compare overall trends or Arctic ice loss for any year, or for all the years we have been collecting data from space.
But in the record low ice year of 2012 (the green dashed line on the time series curves), the Arctic Basin was hit by the Great Arctic Cyclone (GAC) in August of that year. These cyclonic low pressure systems are not unusual in the Arctic, but they usually hit in winter or spring. The GAC churned up the Arctic basin when the ice was weak and thin, breaking it up and helping to disperse it. The combination of an already low ice cover AND the GAC just prior to minimum led to extraordinary destruction of the SIE and an anomalously low extent, even in a decade of extreme low ice (the previous record low was in 2007).
I strongly recommend you link to the Charctic Interactive graphic and explore the time series lines for the last 40 years of the satellite era, and how they document the ice loss (particulaly since the turn of the 21st century). The raw data is dramatic. It is denialist-proof.
I believe there is a very good chance we may get another low-ice record in 2019 even if we don’t have a summer cyclone. The records have been broken about every five years on the average, and we’re way overdue for one.
Yes, it IS that bad.