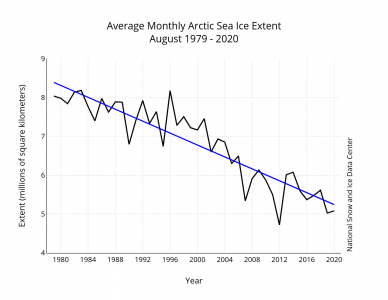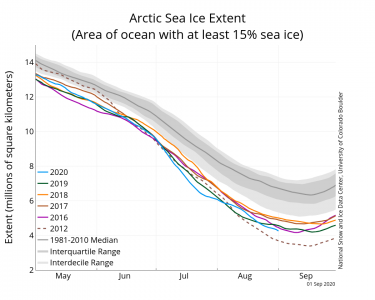
The average August Arctic sea ice extent (nsidc.org) is in. It appears the mid-September minimum will be lower than any other since satellite records began 40 years ago, with the exception of the extraordinary 2012 record breaker. Use the Charctic Interactive Ice Graph at
https://nsidc.org/arcticseaicenews/sea-ice-tools/
and see for yourself how this year is shaping up compared to past years. Plot a few of the time series and see how the level is dropping, year after year. Here is a look at just the last few years

Stay tuned for the September summer minimum numbers, published early in October. Although I don’t expect an all-time low ice record this year, its pretty likely 2020 is heading for a strong second place.

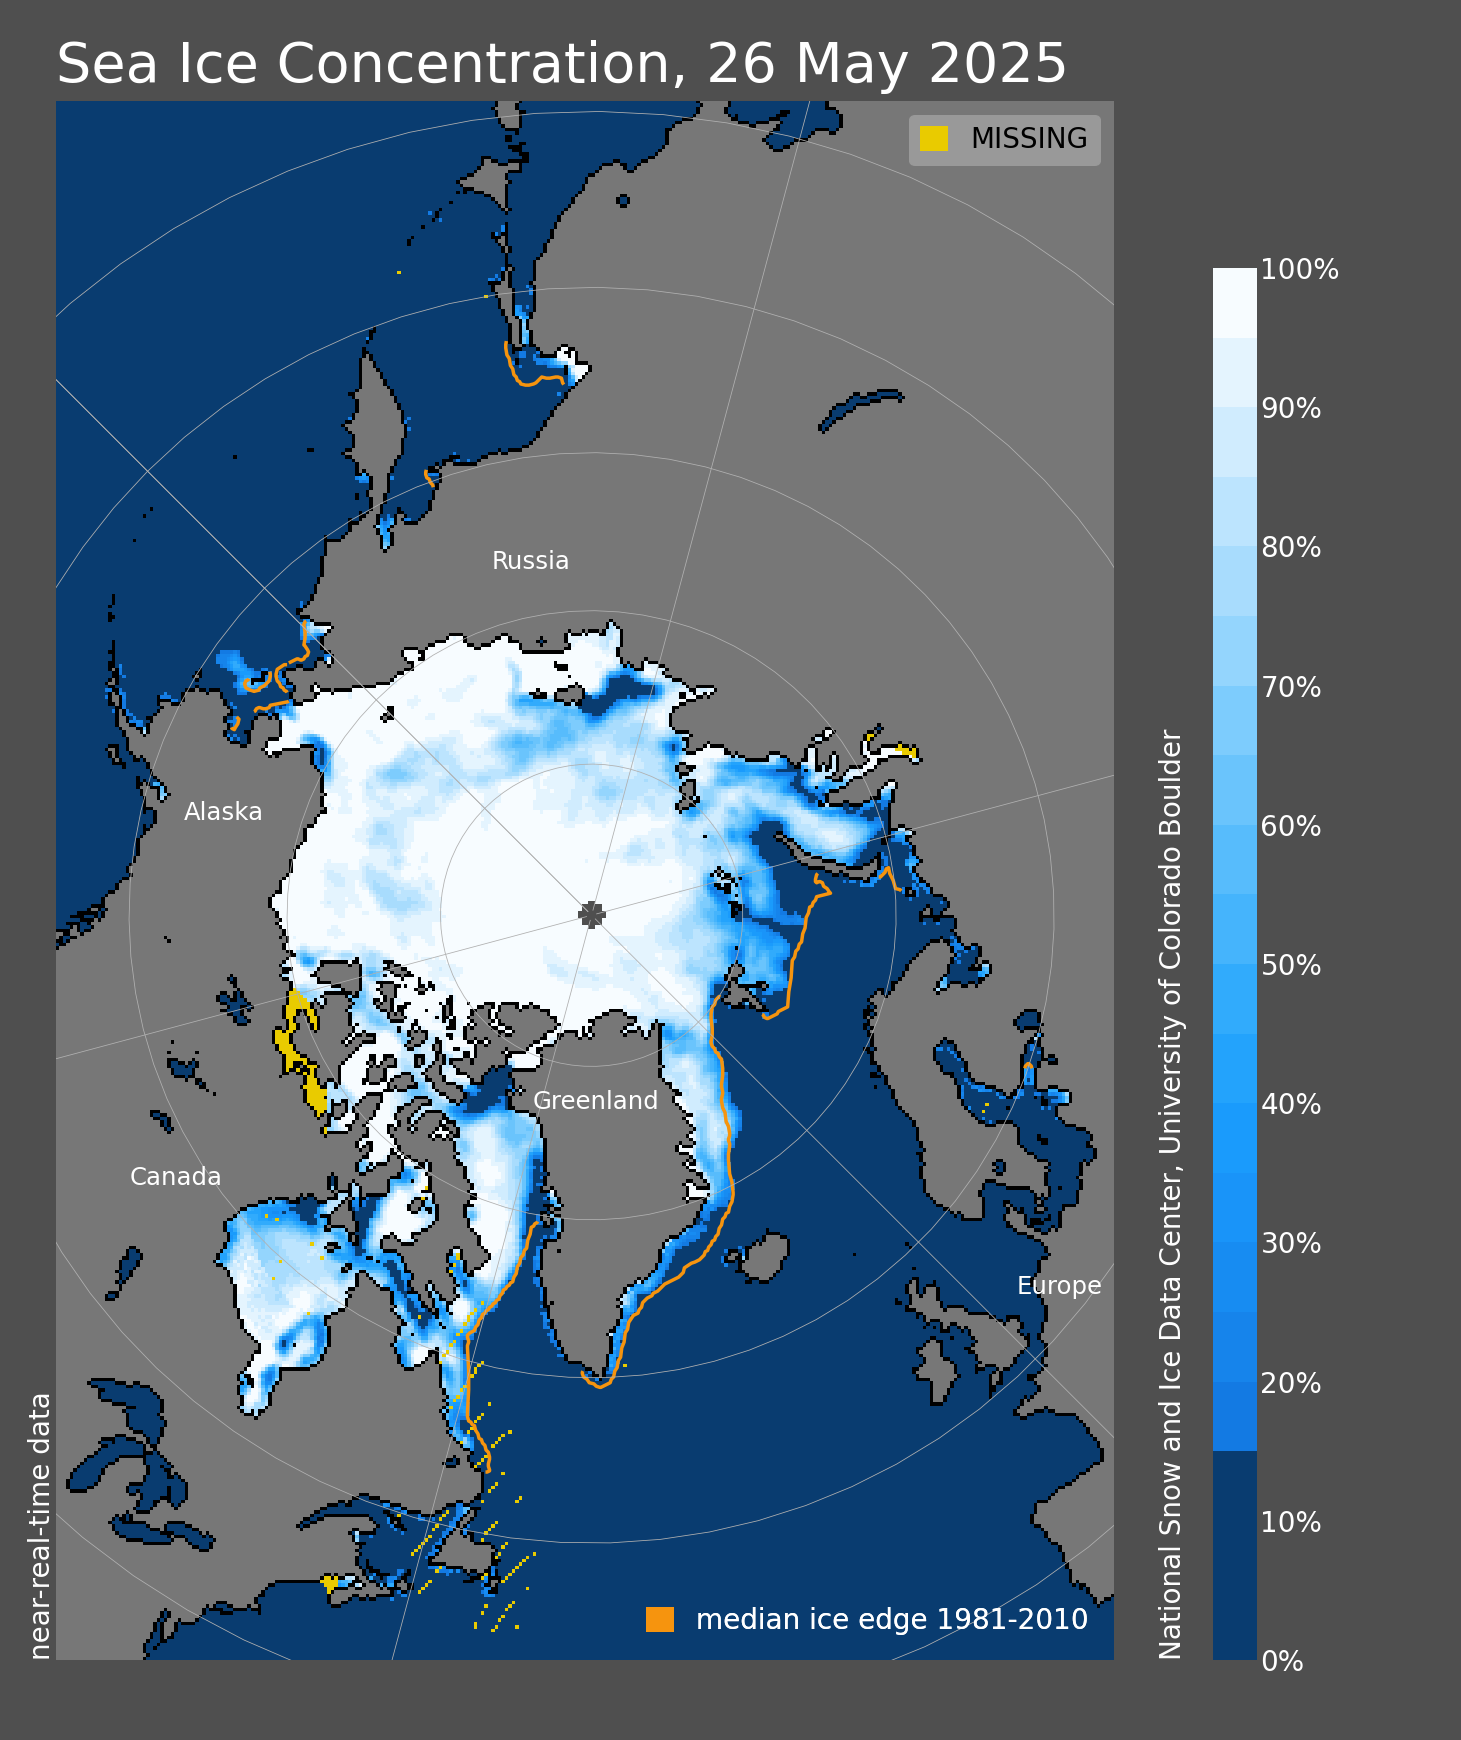
After a period of rapid sea ice loss extending into the last week of August, the rate has slowed with the onset of autumn in the Arctic. A region of low concentration ice persists in the Beaufort Sea. How much of this ice melts over in the next two weeks will strongly determine where the September sea ice minimum will stand in the record books. The Northwest Passage (Amundsen’s route) is largely open but some ice remains. The Northern Sea Route, along the Siberian coast, remains open.
-
More Tundra Farts
-
Greenland Ice Sheet out of equilibrium since 2000
-
What led you originally to believe in your 2008 estimate?
-
Well,
-
Do you have a list of links related to your ice cap posts?
-
I don't.
-
No worries
-
A good glaciology blog:
-
NSIDC.ORG has a link to detailed and recent Greenland icecap studies..
-
No worries
-
I don't.
-
Do you have a list of links related to your ice cap posts?
-
Well,
-
What led you originally to believe in your 2008 estimate?