The average Arctic Sea Ice Extent for each September in the last four decades of satellite observations. Each point of the graph signifies not the minimum point for that September, but the mean SIE for the entire month.
SIE minimum occurs in mid-September.
https://nsidc.org/arcticseaicenews/files/2020/10/Figure-3-350×270.png
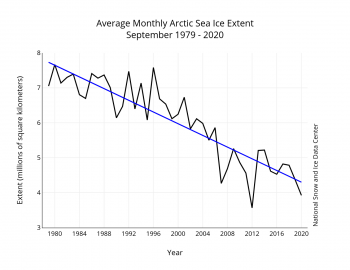
The overall rate of sea ice decline in September is now at 83,700 square kilometers (32,300 square miles) per year, or a rate of ice loss of 13.1 percent per decade relative to the 1981 to 2010 average.
This graphic ranks the warming trend for every month for the entire satellite era. The ranking for each month is indicated by a number and color. So for example, the average SIE for September, 2020 (the last entry) is the 3rd lowest September in recorded history.
https://nsidc.org/arcticseaicenews/files/1999/10/925T_70N_rank-1-350×233.png
![]()
While average and below average air temperature characterized the Arctic Ocean in the winter of 2019 to 2020, exceptionally warm conditions prevailed this past summer. Indeed, the summer of 2020 appears to be the warmest since at least 1979. According to the NCEP/NCAR reanalyses, monthly averaged air temperatures (at the 925 hPa level) over the Arctic Ocean, north of 70 degrees N, were at record highs in May, July, and August. June ranked as the second warmest behind 2005 (Figure 4Wa). Exceptionally high temperatures in May led to early development of melt ponds along the Russian coast (Figure 4b). This, combined with exceptional warmth over Siberia in June and thin ice in the region, fostered by the strongly positive phase of the Arctic Oscillation (AO) in winter (see discussion below), resulted in early development of open water within the Laptev Sea. This led to record low ice extent in the region starting in mid-June. By mid-July, Arctic sea ice extent was tracking at record lows over the period of satellite observations, fueled by the early ice retreat along the Russian coast
I recommend you visit the NSIDC website and look at the hi-res versions of these graphics. This is a big deal, it makes Trump and the Pandemic look like small potatoes.