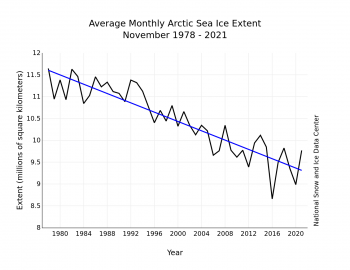
The downward linear trend in November sea ice extent over the 43-year satellite record is 53,300 square kilometers (20,600 square miles) per year, or 5 percent per decade relative to the 1981 to 2010 average. Also based on the linear trend, since 1979, November has lost 2.2 million square kilometers (849,000 square miles). This is equivalent to about three times the size of Texas.
(nsidc.org)
As expected, the trend for November sea ice is down (as it is for every other month!) but we are also seeing an increasing volatility–sort of like the Dow Jones. Like many other trends in climate data, this seems to be pegged to some sort of change-of-state phenomenon which has become established since about the end of 20th century. One-parameter metrics of complex systems often exhibit outbursts of variability as they become extremely unstable.
Am I reading too much into this? What do you folks think?