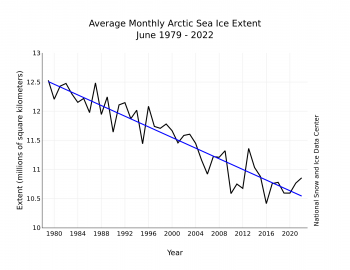
The downward linear trend in June sea ice extent over the 44-year satellite record is 45,700 square kilometers (17,600 square miles) per year, or 3.9 percent per decade relative to the 1981 to 2010 average. Based on the linear trend, since 1979, June has lost 1.97 million square kilometers (761,000 square miles) of sea ice. This is equivalent to about three times the size of Texas.
The summer ice minimum is in Mid-September. That data will be posted early in October.
Its important to keep in mind that Sea Ice Extent (SIE) is not the total boreal ice cover, but the area that is covered by at least 15% sea ice. It is a function of the total amount of ice AND how much it has been dispersed or collected by wind and current. It gives information on how much open water there is to absorb sunlight as the days get longer in Arctic Summer. It also tells us nothing about the thickness of the sea ice. SIE has been chosen as the most useful metric to study ice loss at the poles because it is directly observable by satellite sensor and because it exhibits less volatility and random variation than other parameters. The change of SIE at any particular time of year, compared to previous years, is considered the best way to monitor global warming at the poles. Other metrics, such as ice volume, are not directly observable by sensors, must be modeled, and are consequently more open to debate. They are also less conservative. The sea ice volume in the Arctic has decreased much faster over the years than has the area or the extent. (Not only is there less ice, it is, as a rule, thinner). Predictions based on volume might tend to be seen as “alarmist”.