A new study published in the journal Science links Arctic sea ice loss to cumulative CO2 emissions in the atmosphere through a simple linear relationship (Figure 6). Researchers conducting the study, including NSIDC scientist Julienne Stroeve, examined this linear relationship based on observations from the satellite and pre-satellite era since 1953, and in climate models. The observed relationship is equivalent to a loss of 3 square meters (9.9 square feet) for every metric ton of CO2 added to the atmosphere, compared the average from all the climate models of 1.75 square meters (5.8 square feet). This smaller value, or lower sensitivity, from the models is consistent with findings that the models tend to be generally conservative relative to observations in regard to how fast the Arctic has been losing its summer ice cover.
http://nsidc.org/arcticseaicenews/files/1999/12/Figure5-350×303.png
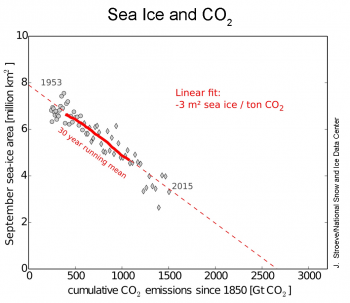
Figure 6. This plot shows the relationship between September sea ice extent (1953 to 2015) and cumulative CO2 emissions since 1850. Grey diamonds represent the individual satellite data values; circles represent pre-satellite era values; the solid red line shows the 30-year running average. The dotted red line indicates the linear relationship of 3 square meters per metric ton of CO2.
Credit: J. Stroeve, National Snow and Ice Data Center High-resolution image