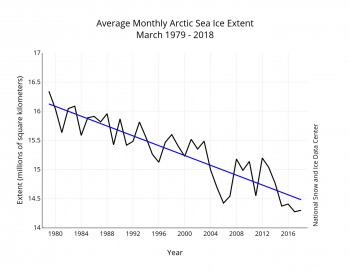
March is when the ice is at its maximum, the sun is just starting to move N of the equator and things are finally starting to warm up after a long, cold, dark winter. Each data point on the series represents the average sea ice extent for the entire month, so it is relatively buffered from local or short term meteorological events.
Consequently, changes in the Arctic are least noticeable in Spring, and year-long trends are least obvious. The graph below displays all the sea ice in the Arctic Basin in all the Marches since the satellites have been gathering data. I dread to think what this graph will look like in September, when the melt will be amplified by the long days of the Midnight Sun.
http://nsidc.org/arcticseaicenews/files/2018/04/Figure3-350×270.png

The linear rate of decline for March ice extent is 42,200 square kilometers (16,400 square miles) per year, or 2.7 percent per decade relative to the 1981 to 2010 average.