https://nsidc.org/arcticseaicenews/files/1999/06/Figure3-1-350×270.png

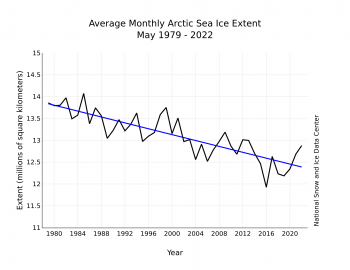
May sea ice extent declined by 1.28 million square kilometers (494,000 square miles), or at a rate of 41,200 square kilometers (15,900 square miles) per day, which was slower than the 1981 to 2010 average. This resulted in an average May extent that ranked fourteenth lowest in the satellite record. The downward linear trend in May sea ice extent over the 44-year-satellite record is 33,700 square kilometers (13,000 square miles) per year, or 2.5 percent per decade relative to the 1981 to 2010 average (Figure 3). Based on the linear trend, since 1979, May has lost 450,000 square kilometers (174,000 square miles) of sea ice. This is equivalent to the size of the state of California.