• Space/Science
  • GeekSpeak
  • Mysteries of
    the Multiverse
  • Science Fiction
  • The Comestible Zone
  • Off-Topic
  • Community
  • Flame
  • CurrentEvents

Recent posts

So you Millennials think the world has given you a raw deal? ER November 25, 2025 5:27 pm (Off-Topic)

This is not a drill. NOT a drill. General Quarters, General Quarters. All hands man your battle stations. ER November 24, 2025 4:58 pm (CurrentEvents)

Xi called Trump RobVG November 24, 2025 10:26 am (CurrentEvents)

I thought this was fake news when I first saw it online BuckGalaxy November 23, 2025 10:13 pm (Space/Science)

And the worms ate into his brain BuckGalaxy November 23, 2025 7:37 pm (CurrentEvents)

Cracks propagate podrock November 22, 2025 8:54 pm (CurrentEvents)

Debunking simulation theory with more simulation theory RobVG November 20, 2025 3:09 pm (Space/Science)

SR72 RobVG November 20, 2025 1:00 pm (Off-Topic)

Carmakers want to build robot armies BuckGalaxy November 18, 2025 5:50 pm (Flame)

Just going to put this out there... BuckGalaxy November 16, 2025 10:46 pm (GeekSpeak)

Moonage Daydream BuckGalaxy November 16, 2025 2:48 pm (Space/Science)

Home » Space/Science

October SIE report October 4, 2023 10:49 pm ER

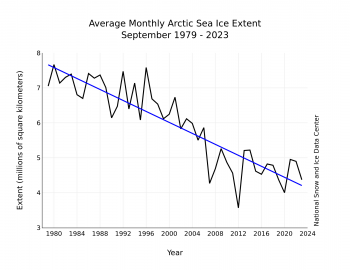
The graph above is the most important display of global warming data published by NSIDC.org

Published in early October, it displays the average sea ice extent for the lowest average September ice cover in the Arctic Basin, along with September averages for all the years the satellites have been observing the icecap. Although SIE hits its annual low in mid September, posting the full month average damps down most of the noise in the data, irregularities due to wind and current breaking up and clumping floating ice. The blue regression line represents the general trend. Since 1979 the summer ice has gone from about 7.6 to 4.2 million square kilometers (by just eyeballing the graph). About half of the Arctic Ocean’s summer ice has disappeared in the last 40-odd years.

The downward linear trend in Arctic sea ice extent for September over the 45-year satellite record is 78,500 square kilometers (20,300 square miles) per year, or 12.2 percent per decade relative to the 1981 to 2010 average (Figure 3). Based on the linear trend, since 1979, September has lost 3.45 million square kilometers (1.33 million square miles) of ice. This is roughly equivalent to twice the size of Alaska or Iran.

At this rate, the summer Arctic ice cap will be ice free by the end of this century.

    Search

    The Control Panel

    • Log in
    • Register