http://nsidc.org/arcticseaicenews/files/2017/06/monthly_ice_05_NH_v2.1-350×270.png
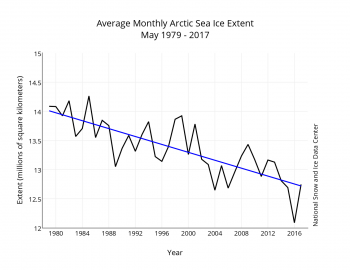
The volume is at an all-time low for this time of year, but the extent, although still trending down, is not. How can this be? “Ice extent” refers to surface of the sea covered by at least 15% floating ice, regardless of thickness. Ice extent, although directly measurable by satellite, and easily compared to past measurements, can vary from day to day depending on how weather, wind and currents disperse or collect floating ice.
However, what is logged and compared in this time series is the AVERAGE ice extent for the entire month. Again, any particular value by itself means nothing, but the trend, expressed by the regression line in blue, is unmistakable: the ice is melting in every single month of the year. All these monthly graphs look pretty similar, even though the slopes are much more severe in the summer. But they adjust the y-scale to spread out the values across the entire range of the 1979-2017 domain.
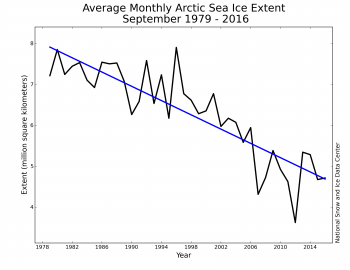
The May ice extent averages are dropping at about 2.5%/decade. By contrast, the September ice extent
is decreasing at the rate of about 13%/decade—about five times faster. That, of course, assumes we fit a linear regression to the data points. If you look at those dots carefully, it appears a higher order curve should be fitted. The summer ice isn’t just melting, its melting faster every year.
Check it out. Here’s the same graph, for Septembers
1979-2016.
http://nsidc.org/arcticseaicenews/files/2016/10/monthly_ice_09_NH-350×270.png