• Space/Science
  • GeekSpeak
  • Mysteries of
    the Multiverse
  • Science Fiction
  • The Comestible Zone
  • Off-Topic
  • Community
  • Flame
  • CurrentEvents

Recent posts

I hate waking up to war podrock February 28, 2026 11:04 am (CurrentEvents)

The religion of nonreligion can be like nonalcohol beer: What’s the point? BuckGalaxy February 28, 2026 2:25 am (Off-Topic)

MAGAlomania unleashed again BuckGalaxy February 28, 2026 2:21 am (CurrentEvents)

‘We’re Going to the Moon and Mars’ BuckGalaxy February 26, 2026 8:41 pm (Space/Science)

Is This the Most Important Supreme Court Case of the Century? BuckGalaxy February 22, 2026 8:56 pm (CurrentEvents)

Supreme Court tries to do Trump a favor BuckGalaxy February 20, 2026 10:58 am (CurrentEvents)

Role reversal ER February 20, 2026 7:58 am (Off-Topic)

When Will This War End? The Question Is Meaningless. BuckGalaxy February 15, 2026 5:56 pm (CurrentEvents)

AI progress RL February 14, 2026 1:59 pm (Space/Science)

A Rubicon of Sorts ER February 12, 2026 5:33 pm (Space/Science)

Somebody help me out with telephone games. ER February 12, 2026 5:00 pm (CurrentEvents)

"Trump in heels" leads America's surrender in the global information war. BuckGalaxy February 11, 2026 12:08 pm (Flame)

Home » Space/Science

Measuring Marine Mean March Melt Maxes April 7, 2018 5:02 am hank

March is when the ice is at its maximum, the sun is just starting to move N of the equator and things are finally starting to warm up after a long, cold, dark winter. Each data point on the series represents the average sea ice extent for the entire month, so it is relatively buffered from local or short term meteorological events.

Consequently, changes in the Arctic are least noticeable in Spring, and year-long trends are least obvious. The graph below displays all the sea ice in the Arctic Basin in all the Marches since the satellites have been gathering data. I dread to think what this graph will look like in September, when the melt will be amplified by the long days of the Midnight Sun.

http://nsidc.org/arcticseaicenews/files/2018/04/Figure3-350×270.png

.

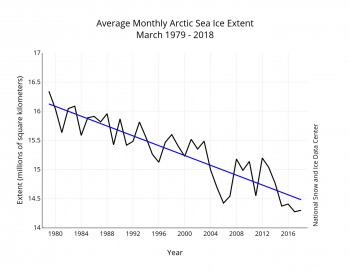
The linear rate of decline for March ice extent is 42,200 square kilometers (16,400 square miles) per year, or 2.7 percent per decade relative to the 1981 to 2010 average.

  • Clever climate contrarians could crazily claim: "Maybe Maunder Maximums might make meager March melt maximums" by RL 2018-04-07 18:56:56
    • Thanks, I needed that. by hank 2018-04-07 20:20:50
    • Arctic monthly air temp rankings by hank 2018-04-07 05:31:34

      Search

      The Control Panel

      • Log in
      • Register