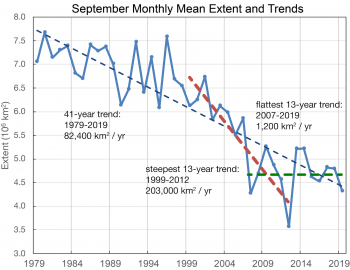
The following graphic, published by our friends at nsidc.org, illustrates how easy it is to misrepresent statistical time series data by carefully selecting the sampling interval. In any type of erratic data or information containing a high amount of intrinsic random variability, it is possible to prove almost anything you want by carefully adjusting the sampling parameters. In this dataset, which shows the decline in deep summer polar sea ice cover for the last 40-odd years, it is possible to distort the overall trend by exploiting the variability of the data.
I show this here because it is a technique used often by AGW denialists to illustrate how “there really is no AGW problem”, or how the ice is “rebounding” or “recovering”. The fact that these people are able to deliberately distort the meaning of this data proves beyond a doubt that they are not merely mistaken or ignorant: they are deliberately misleading. They know exactly what they’re doing, and why.
This is not a question of difference of opinion or misinterpretation of data. They are just lying, and they’re doing it for money.
https://nsidc.org/arcticseaicenews/files/1999/10/Sep_monthly_extents13yr-350×270.png
By now, the nature of AGW and the evidence of its effects has become so obvious and dramatic that this type of data misrepresentation is becoming rarer and rarer. It just doesn’t wash any more. The denialist community is starting to invoke new lies, and come up with other excuses, in order to distract us from the problem. Keep your eyes open and stay alert for the latest obfuscations. These people are ruthless, and they will stop at nothing to further their short-term financial agenda.