• Space/Science
  • GeekSpeak
  • Mysteries of
    the Multiverse
  • Science Fiction
  • The Comestible Zone
  • Off-Topic
  • Community
  • Flame
  • CurrentEvents

Recent posts

Meanwhile, bye bye National Forest Service podrock April 9, 2026 8:13 am (CurrentEvents)

Is Isreal really a US ally RobVG April 8, 2026 5:21 pm (CurrentEvents)

Eventually, one has to just admit it. podrock April 6, 2026 8:08 pm (CurrentEvents)

Where no one has gone before BuckGalaxy April 6, 2026 7:49 pm (Space/Science)

Moon noticeably getting larger in live stream RL April 6, 2026 4:23 am (Space/Science)

Regime Change BuckGalaxy April 4, 2026 4:22 pm (CurrentEvents)

HERE WE GO, BABY! BuckGalaxy April 1, 2026 3:07 pm (Space/Science)

April Fool's Day ER April 1, 2026 7:56 am (Space/Science)

A Big Beautiful Bunker podrock March 31, 2026 10:11 am (CurrentEvents)

Artemis II is scheduled to launch on Wednesday, April 1, 2026, at 6:24 p.m. EDT BuckGalaxy March 30, 2026 3:09 pm (Space/Science)

Dragonfly mission to Titan BuckGalaxy March 29, 2026 12:01 pm (Space/Science)

It's a long long road... BuckGalaxy March 26, 2026 4:49 pm (Space/Science)

Home » Space/Science

Antarctic sea ice extent hits a third low in a row February 28, 2024 4:44 pm ER

https://nsidc.org/arcticseaicenews/

February 28, 2024

On February 20, Antarctic sea ice likely reached its minimum extent of 1.99 million square kilometers (768,000 square miles), tying for second lowest extent in the 1979 to 2024 satellite record. This is the third consecutive year that Antarctic sea ice has reached a minimum below 2.0 million square miles (772,000 square miles).

Please note that this is a preliminary announcement. Changing winds or late-season melt could still reduce the Antarctic ice extent. NSIDC scientists will release a full analysis of the Antarctic and Arctic February conditions in early March.

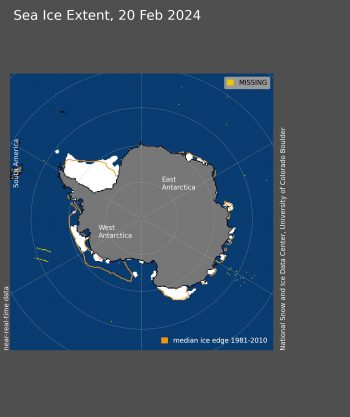
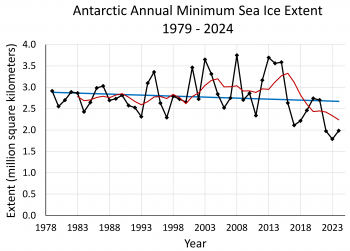
Figure 2b. This graph shows Antarctic annual sea ice minimum extent, depicted as black diamonds, from 1979 to 2024, based on a 5-day running average of daily extent. The linear trend line is in blue with a 1.7 percent per decade downward trend, which is not statistically significant. A five-year running average is shown in red.

    Search

    The Control Panel

    • Log in
    • Register